Category: Projects
Multiscale MR and GTtour
I first discovered the notion of multiscale methods in one of NECSI’s Complex Systems summer courses as a grad student. Not surprisingly they were extremely “mathy” which is great, but I got to thinking about what the qualitative properties of these methods might be. Then about a year or so later Mary Hegarty gave a talk at Georgia Tech about her work in spatial scale and, although these are slightly different notions of scale, I began to see a path forward. One prominent stop on that path was my PhD dissertation work on spatial scale in Mixed Reality. The connection is a simple one, if we experience space at different scales, and we use partially overlapping cognitive abilities at those different scales, then how do these play out in the interactive environments of Mixed Reality?
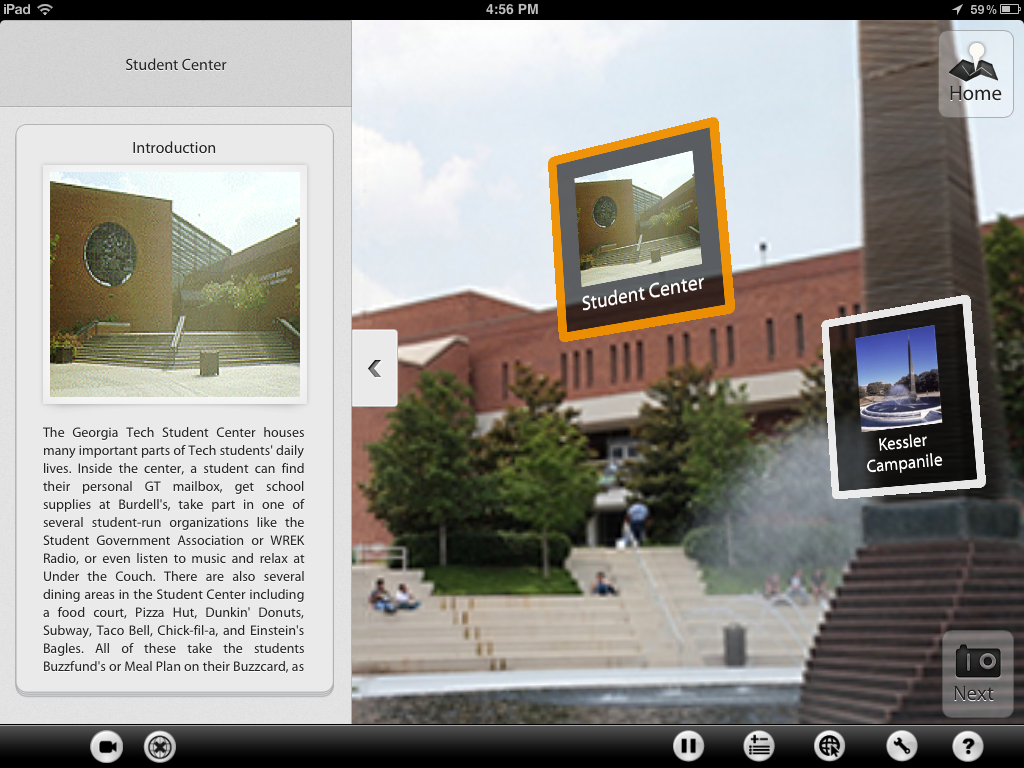
One of the major breakthroughs I had was in developing the notion of scale transitions. Multiscale MR experiences need some clear way to move the user through information at different spatial scales. There are emerging techniques and best practices for doing this, just like in the early days of filmmaking, and these need to be catalogued, expanded upon, and critiqued, just like cuts in film. My dissertation explored these ideas in the context of GTtour a MR tablet experience that let users take a virtual tour of the Georgia Tech campus. The good folks at RNOC helped me put together the tour. I’m not sure if it’s still in use but nonetheless it was really my first foray into mulitscale methods.
DolphinVIZ
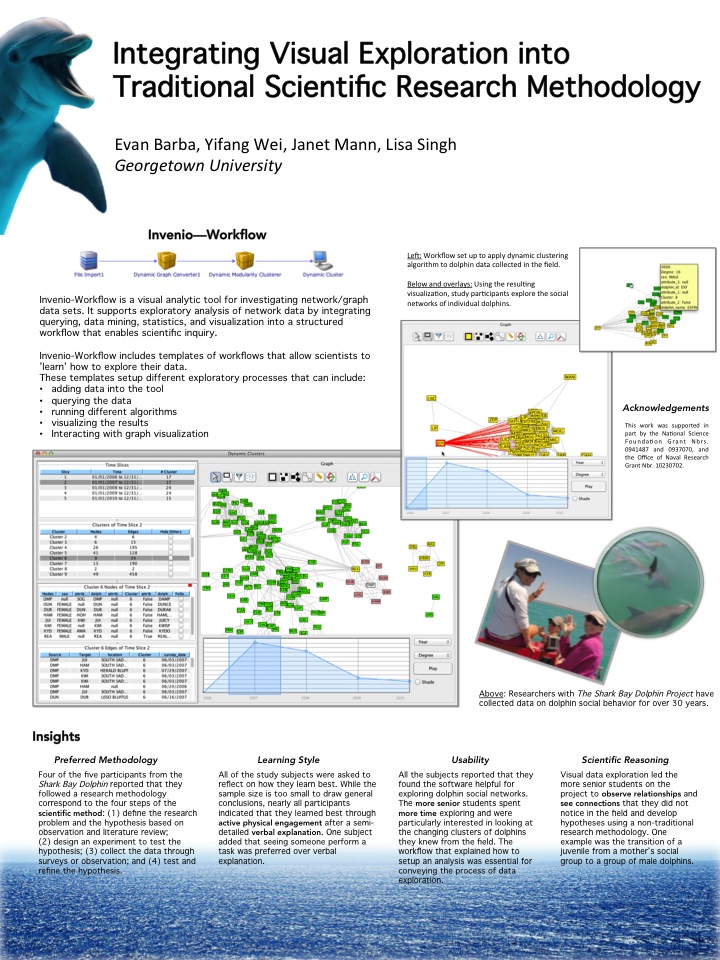
I did a really nice study with Lisa Singh and Janet Mann looking at how some of the student researchers on Janet’s research team used Lisa’s visualization software (Invenio Workflow) to explore field data on dolphin social networks. There are only a few students in the research group so the n for this study is too small to draw any generalizable conclusions from, but we did learn a lot about difficult it is to connect observations in the field with raw data. For long term projects like this new people constantly come onto the team and a lot of the embodied knowledge that researchers have through years of field observations and data collection is lost when those researchers leave because it’s hard to transfer that kind of tacit knowledge to a new team member. It seems that visualization can help keep some of the continuity. The really interesting next step question I’ve been asking here is whether doing some work with visualization beforehand can inform student researchers observations in the field. Continuity goes both ways after all.
Check out our VAST poster below.
VR Courtroom
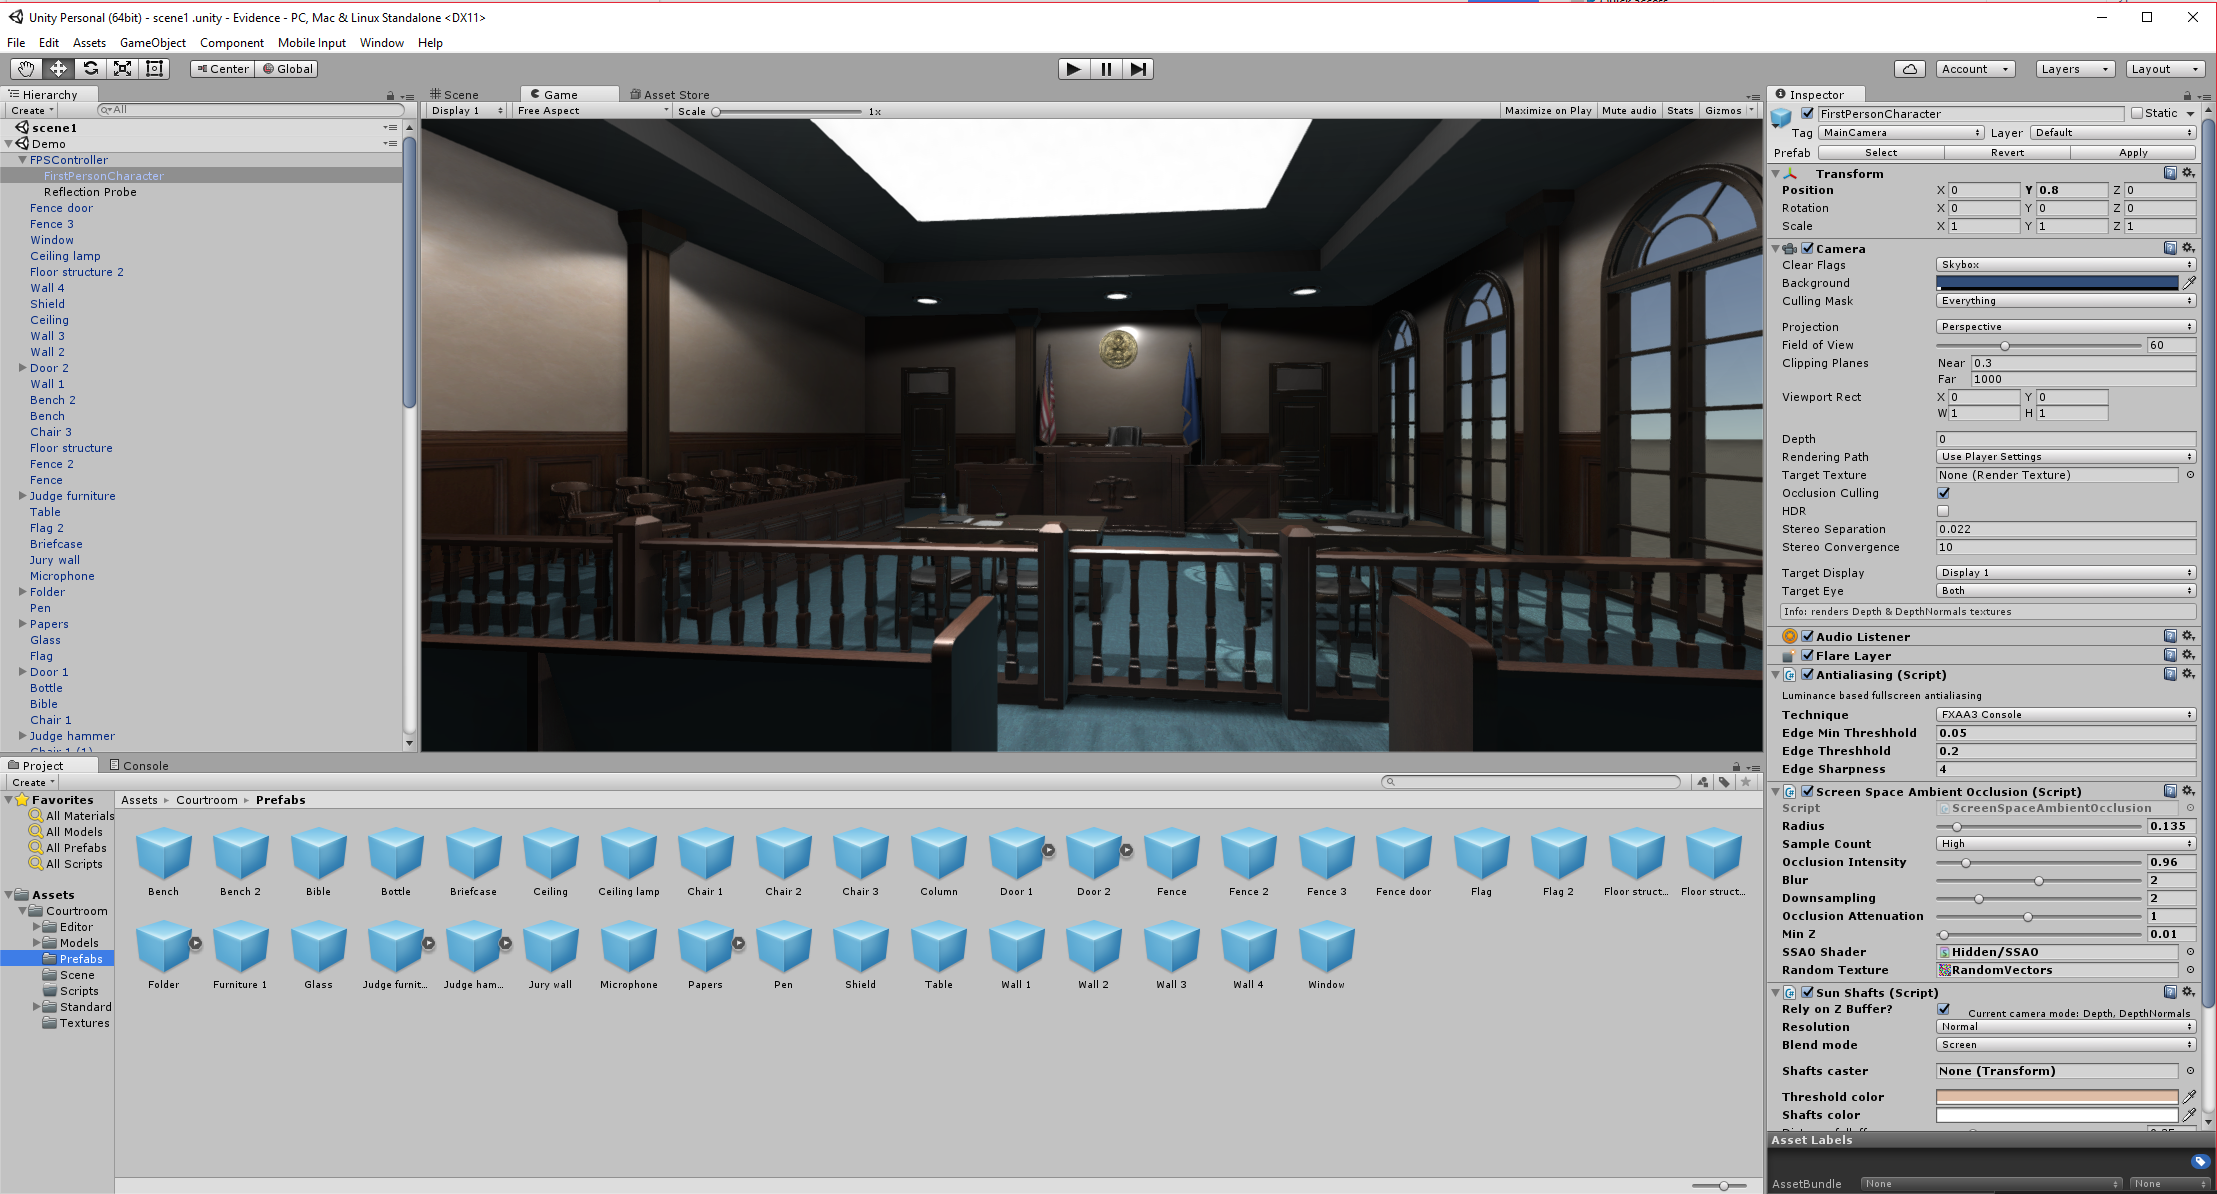
I’ve been working with a wonderfully talented CS post-bacc student and Tanina Rostain from Georgetown’s Law School to develop a VR courtroom simulator for training law students. I never realized, but it makes perfect sense, that it is really difficult for law students to get any experience in an actual courtroom. I can’t imagine the bureaucratic hurdles to doing that and I’m sure it’s very expensive to build a replica (although the production designer in me thinks it would be a fun thing to try).
We’re adapting a web-based card game that they made some time ago to work as a complete VR simulation of the witness statement and cross-examination parts of legal proceedings. We’re looking at whether this kind of immersive simulation can help law students overcome some of the anxiety associated with being in court for the first time. From there the sky is the limit. I can imagine entire courtroom dramas played out in interact VR, although spending the entire length of a trial with a VR headset on seems like it would incapacitate you for at least three days afterward.
Measuring Sophistication
I’ve been intrigued by the research on Learning Progressions for some time now, and I’m particularly interested in broadening this concept. There are many valid critiques of this idea, that I believe come from a sincere desire to better measure student learning. For one, learning is multidimensional and our current educational system breaks this learning down into subjects. While there is currently no way to get around this deeply entrenched system, there are better ways of dealing with it. Another problem is that the way Learning Progressions define “sophistication,” the thing we are supposed to be measuring is very poorly understood, usually it comes down to domain knowledge, but this only scratches the surface.
To deal with these issues and many others, JR Osborn and I have begun using a new grading system in our Fundamentals of Technology course. This course is aimed at teaching our incoming students the essentials of (in our opinion) the three most important subjects in 21st century education: Systems, Design, and Computing, SDC for short. Instead of grading unidimensionally, we grade on six different dimensions, one for each of the three subjects and one for each intersection of the three. You can see this depicted in the diagram below.
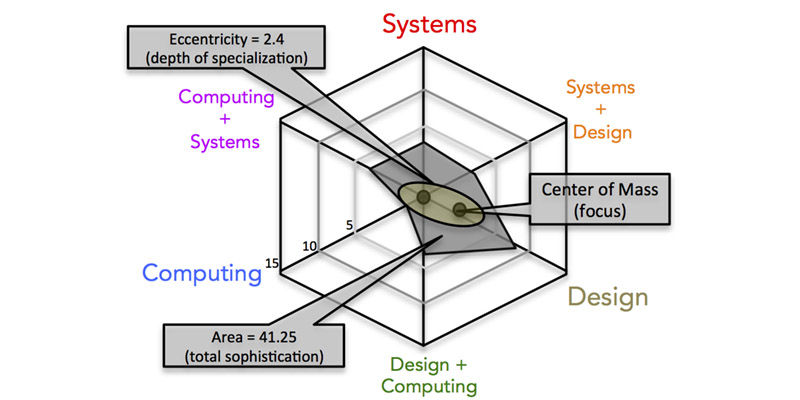 The reason we’ve come to love this approach, despite it being a bit more work (there are only two of us after all) is that we get to give a traditional grade but we don’t lose any of the detailed information that the grade is based on. Also, we get to use radar charts in a new way and we really like radar charts. In fact, no one has really noticed that these charts have a particular emergent property (there’s that systems thinking again!) that effectively measures sophistication. When you give a score along each dimension you know how well a student does in that topic or subject, but when you connect these dots on a radar graph you get an emergent hexagon that depicts the learner at a glance. It’s a great visual tool, but the math is what’s totally killer about this approach. That hexagon has useful emergent properties. The area represents the “total sophistication” of a student, so it works the same way as a traditional grade, but you can also calculate the center of mass, which correlates to a student’s specialization, and you can use that center of mass along with the center of the chart as foci in an ellipse which tells you a student’s depth of specialization or “eccentricity.” Shallow students are generalists, narrow ones are specialists. The diagram says it all.
The hexagon also has a perimeter, but we haven’t correlated that with anything yet…
Instigator Subsystems
I’ve talked before about how I’m drawn to projects that “check all my boxes” for interesting research, worthwhile teaching, and community engagement. One of the best examples I have comes from my work with Audrey Stewart on sustainable campus planning. In Fall 2014 we taught a course called Sustainability Theory and Practice. The graduate and undergraduate students in that course spent the semester learning about sustainability by competing in the EPA’s annual RainWorks Challenge design competition. We created two design boards and a design brief for our project transforming the environment around Georgetown’s iconic Lauinger Library into a model of sustainable landscaping. The students did an amazing job. They learned how professionals do Green Infrastructure design with the help of DC Water’s design team. They learned a ton about infrastructure and landscaping for water retention, and they even learned a bit about how institutions do business.
Everybody won with this project, which still echoes at Georgetown today. Our design team took home Honorable Mention in the competition (no small task for design novices competing with professional schools), Georgetown and DC water began a long-standing conversation about increasing Green Infrastructure on campus, and Audrey and I did some great research (2 conference proceedings and one paper in FORMakademisk).
As usual, I learned a lot about multiscale design and got introduced to similar concepts in organizational management research. We used Prigogine’s notion of dissipative structures as a model for harnessing second-order cybernetic effects to get results at multiple levels of an organizational hierarchy. In the process we invented what we called Instigator Subsystems, which are small systems (like our course) that aim to have predictable higher scale effects (at the level of facilities planning in this case) which continue after the instigator subsystem disappears. If that sounds interesting you should check out the research paper. If it doesn’t, there might still be some hope for you yet…

 D5 Creation