Measuring Sophistication
I’ve been intrigued by the research on Learning Progressions for some time now, and I’m particularly interested in broadening this concept. There are many valid critiques of this idea, that I believe come from a sincere desire to better measure student learning. For one, learning is multidimensional and our current educational system breaks this learning down into subjects. While there is currently no way to get around this deeply entrenched system, there are better ways of dealing with it. Another problem is that the way Learning Progressions define “sophistication,” the thing we are supposed to be measuring is very poorly understood, usually it comes down to domain knowledge, but this only scratches the surface.
To deal with these issues and many others, JR Osborn and I have begun using a new grading system in our Fundamentals of Technology course. This course is aimed at teaching our incoming students the essentials of (in our opinion) the three most important subjects in 21st century education: Systems, Design, and Computing, SDC for short. Instead of grading unidimensionally, we grade on six different dimensions, one for each of the three subjects and one for each intersection of the three. You can see this depicted in the diagram below.
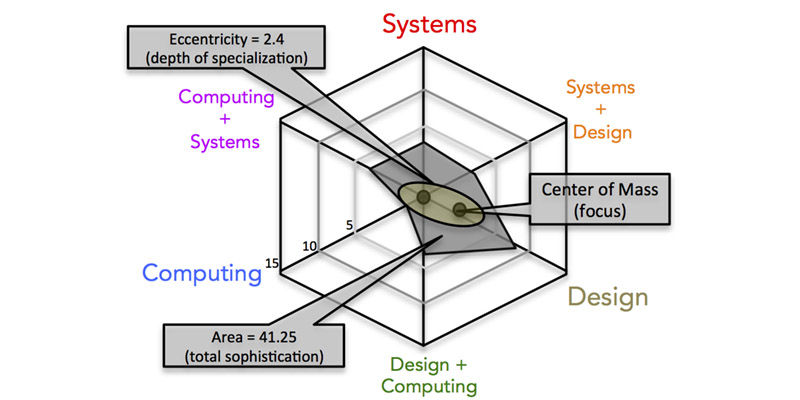 The reason we’ve come to love this approach, despite it being a bit more work (there are only two of us after all) is that we get to give a traditional grade but we don’t lose any of the detailed information that the grade is based on. Also, we get to use radar charts in a new way and we really like radar charts. In fact, no one has really noticed that these charts have a particular emergent property (there’s that systems thinking again!) that effectively measures sophistication. When you give a score along each dimension you know how well a student does in that topic or subject, but when you connect these dots on a radar graph you get an emergent hexagon that depicts the learner at a glance. It’s a great visual tool, but the math is what’s totally killer about this approach. That hexagon has useful emergent properties. The area represents the “total sophistication” of a student, so it works the same way as a traditional grade, but you can also calculate the center of mass, which correlates to a student’s specialization, and you can use that center of mass along with the center of the chart as foci in an ellipse which tells you a student’s depth of specialization or “eccentricity.” Shallow students are generalists, narrow ones are specialists. The diagram says it all.
The hexagon also has a perimeter, but we haven’t correlated that with anything yet…
 D5 Creation